Postgres Performance Monitoring
When running a PostgreSQL instance under heavy load, it is quite probable to encounter situations when the server gets overwhelmed. It could be that a burst in traffic to your application sent a frenzy of queries that the database cannot cope with. It could also be that a relatively low number of heavy queries were issued: full table scans, heavy joins, etc. Whatever the cause, database performance degrades which usually means that your application performance degrades.
There are multiple ways to figure out what is the cause for database performance problems. I will try touch on several, highlighting their purpose.
Slow Query Log
Probably the best known tool to troubleshoot database performance issues is the slow query log. It can usually be enabled in the configuration of the server along with the minimum execution duration to log. A common practice is to log queries that run for longer than 5 seconds.
A PostgreSQL database slow query log might look like this:
LOG:  duration: 2.176 ms  statement: UPDATE pgbench_accounts SET abalance = abalance + -239 WHERE aid = 70108;
LOG:  duration: 1.113 ms  statement: SELECT abalance FROM pgbench_accounts WHERE aid = 21621;
LOG:  duration: 3.671 ms  statement: UPDATE pgbench_accounts SET abalance = abalance + 3998 WHERE aid = 34797;
LOG:  duration: 2.158 ms  statement: UPDATE pgbench_accounts SET abalance = abalance + -324 WHERE aid = 82301;
LOG:  duration: 1.030 ms  statement: UPDATE pgbench_accounts SET abalance = abalance + 3702 WHERE aid = 82991;
LOG:  duration: 1.001 ms  statement: UPDATE pgbench_accounts SET abalance = abalance + -920 WHERE aid = 21191;
This can immediately reveal problems like missing indexes, full table scans and expensive join queries. It is a useful tool to have and a good intro to discovering problems with the database.
On the other hand, this only detects long-running queries. A database can be overwhelmed by many short-running queries as well. During a burst of traffic, many short-running queries might exhaust resources of the whole database server which can cause the majority of queries to take a long time. In this scenario, the information in the slow query log becomes less useful - it just starts logging most queries, not only problematic ones.
Currently Running Queries
During an outage or when traffic is elevated, it could be useful to check what queries are currently being executed. Postgres provides this by executing SELECT * FROM pg_stat_activity. This is similar to the top utility found in Linux systems.
pgbench=# select * from pg_stat_activity where usename='pgbench';
 datid | datname | usename | wait_event_type | wait_event | state               | query
-------+---------+---------+-----------------+------------+---------------------+---------------------------------------------------------------------------------------------------------
 16387 | pgbench | pgbench | Client          | ClientRead | idle                | SELECT abalance FROM pgbench_accounts WHERE aid = 95062;
 16387 | pgbench | pgbench |                 |            | active              | SELECT abalance FROM pgbench_accounts WHERE aid = 83859;
 16387 | pgbench | pgbench | Client          | ClientRead | idle in transaction | INSERT INTO pgbench_history (tid, bid, aid, delta, mtime) VALUES (8, 1, 30162, 795, CURRENT_TIMESTAMP);
As mentioned, this is a great tool during an outage. Often, if a severely problematic query is spotted, one can kill that query to quickly remediate the outage.
The pg_stat_statements View
The Postgres manual describes pg_stat_statements as:
The pg_stat_statements module provides a means for tracking execution statistics of all SQL statements executed by a server.
This module provides aggregated data on query execution. It groups queries that Postgres deems to be the same and records, among other things, the total time spent on a group of queries, how many times the query has been executed and amount of rows affected. This is quite cheap for Postgres to keep track of, but provides invaluable insights.
For example, the total time spent on the query immediately points to what the database is busy with the most. It could be millions of sub-millisecond queries or a few hundred of 500 millisecond queries. Regardless, from that information we can gain visibility on the queries producing most work.
pgbench=# select userid, query, calls, total_exec_time, rows, shared_blks_hit, shared_blks_read from pg_stat_statements;
 userid |                                                query                                                 | calls |  total_exec_time   |  rows  | shared_blks_hit | shared_blks_read
--------+------------------------------------------------------------------------------------------------------+-------+--------------------+--------+-----------------+------------------
  16386 | SELECT abalance FROM pgbench_accounts WHERE aid = $1                                                 | 76239 | 3701.8271059999806 |  76239 |          199082 |            32631
  16386 | UPDATE pgbench_accounts SET abalance = abalance + $1 WHERE aid = $2                                  | 18810 | 3108.3800329999913 |  18810 |           71788 |            12257
  16386 | UPDATE pgbench_tellers SET tbalance = tbalance + $1 WHERE tid = $2                                   | 16378 |  518.6385769999977 |  16378 |           32762 |                0
  16386 | alter table pgbench_accounts add primary key (aid)                                                   |     4 | 377.80120800000003 |      0 |            1052 |             5920
  16386 | UPDATE pgbench_branches SET bbalance = bbalance + $1 WHERE bid = $2                                  | 16378 |  376.4261209999991 |  16378 |           32762 |                0
  16386 | INSERT INTO pgbench_history (tid, bid, aid, delta, mtime) VALUES ($1, $2, $3, $4, CURRENT_TIMESTAMP) | 18810 | 369.17452200000105 |  18810 |           19061 |               14
From the example above, we see that the server spent a comparable amount of time on the SELECT abalance... and UPDATE pgbench_accounts... queries, although they were called a very different number of times - a difference of more than 4 times. At the same time, even though, UPDATE pgbench_tellers... was called the same number of times as the other update query, it took 6 times less time. There can be various reasons for the disparity, but the important thing is that we now have a good picture of what the Postgres server is most busy with.
Another useful metric is the amount of rows retrieved or affected by a query. This can point to queries that involve a lot of rows, i.e. expensive COUNTs.
Monitoring Over Time
Data from pg_stat_statements is useful to look at during an outage. However, it becomes even more useful when it can be queried for a particular time window.
Think of a spike in latency caused by querying data of a customer that happens to have a huge dataset in your database. Let’s say that the same query runs hundreds of times per second for other customers. But for this particular customer, it took a few minutes and hogged most of the resources of the server.
Querying pg_stat_statements an hour or even minutes after the incident would probably not yield useful information. However, if we could see the results from pg_stat_statements in a particular time window, we might be able to see the offending query.
Tools that track pg_stat_statements over time include Percona Performance Monitor, Datadog Database Monitoring or even the Postgres Exporter for Prometheus. Although the latter might not perform well with lots of different queries over time.
I will use Datadog Database Monitoring as an example to demonstrate how monitoring pg_stat_statements over time can be a great tool to gain deep insight into your database server.
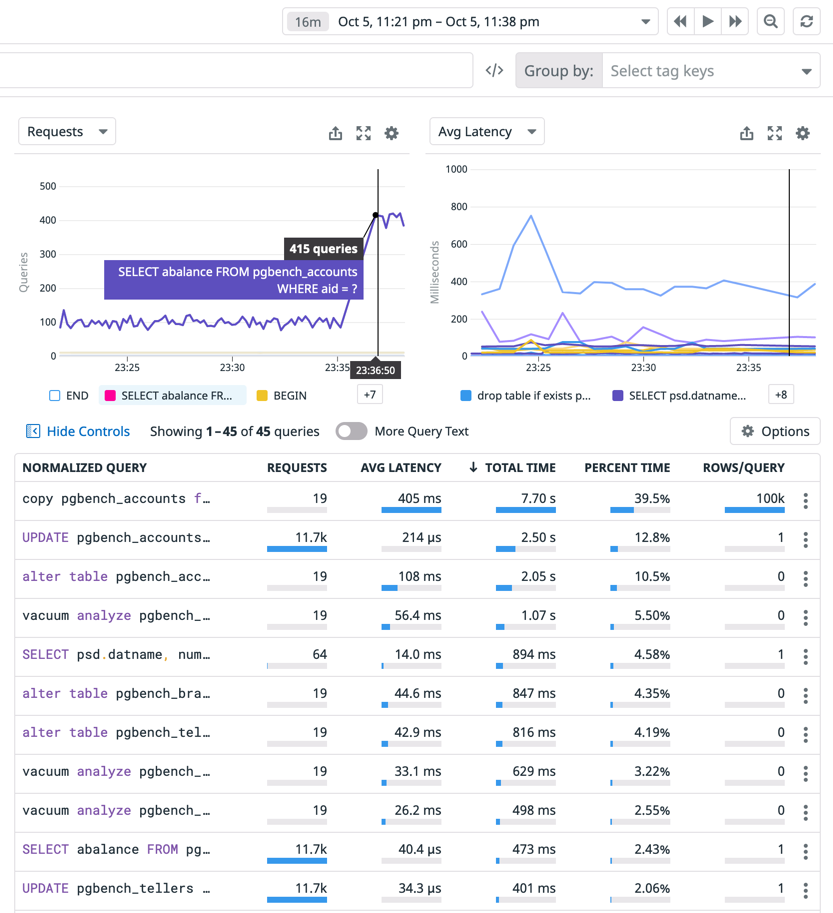
The screenshot shows how data from pg_stat_statements can be useful when analyzed for a specific time window.
Firstly, Postgres spent most of its time on the copy pgbench_accounts query. Event though it was executed only 19 times in the given time window, average latency per query was 405 ms. The next query that took a lot of the server’s time was the UPDATE pgbench_accounts one. It ran only for 214 microseconds on average per query, but was executed almost 12 thousand times. This enables us to see which queries could be optimised to reduce load of the server.
Secondly, the chart in the top left corner, shows that the rate of SELECT abalance queries increased at 23:26. If our application becomes slower at that time, there is a good chance it was caused by that query.
Finally, in this view, we can jump to the time of an incident to explore what the server was up to then. This enables us to analyse database performance without the stress of an ongoing outage.
To reiterate, Datadog Database Monitoring is just one tool that provides this service. There are other services and open source self-hosted solutions that provide the same insights.
Conclusion
Postgres provides great tools to analyze performance and detect problematic queries. In addition, there are even more great tools out there that build on top of what Postgres offers. When you know where to look, reasons for a PostgreSQL server behaving in a certain way become quite clear.